
What is regression analysis and why do we use it in our differentiation platform?
Many managers who use our AI platform know that they need to make data-driven decisions as part of their business. One of the main types of data analysis we use is regression analysis. Our role is not only to provide the data, but also to help understand and correctly interpret the analyses performed.
Regression analysis is a powerful statistical method for examining the relationship between two or more variables of interest. It provides detailed information that can be used to improve products and services. These in turn influence sales. It asks the following questions: Which factors are most important? Which ones can we ignore? How do these factors interact? And, perhaps most importantly, how certain are we about all these factors?
In regression analysis, these factors are called “variables”. You have your dependent variable – the main factor you’re trying to understand or predict. Then you have your independent variables, i.e. the factors you believe have an impact on your dependent variable.
Regression analysis provides highly detailed information that can be used to improve products and services.
At LReply, we offer hands-on training on our platforms, during which customers learn how to master this instrucment to better interpret survey results.
As an example, to understand the added value of these training sessions, we distribute follow-up surveys to participants to find out what they liked, what they didn’t like and what we can improve for future sessions.
The data collected from these surveys enables us to measure the levels of satisfaction our participants associate with our events, and the variables that influence these satisfaction levels.
Is it the topics covered in the various event sessions? Session length? The date of the session? The food or catering provided? The cost of participation? All these variables can have an impact on participant satisfaction levels.
By performing a regression analysis on the survey data, we can determine whether these variables had an impact on overall participant satisfaction, and if so, to what extent.
This information tells us which elements of the sessions are well received, and what we need to focus on to make participants more satisfied in the future.
How does regression analysis work?
In our training example, participant satisfaction with the event is our dependent variable. Topics covered, duration of sessions, food provided and cost of attendance are our independent variables.
In this case, we’d like to measure historical levels of satisfaction with an event over the last three years or so (or any other period you deem statistically significant), as well as any possible information on the independent variables.
We would be particularly interested to know how the price of entry to the event affects satisfaction levels.
The regression line represents the relationship between our independent variable and our dependent variable.
The formula for a regression line might look like Y = 50 + 7X + error term.
If X is the increase in the price of participation, this means that if the price of participation does not increase, satisfaction with the event will still increase by 50 points.
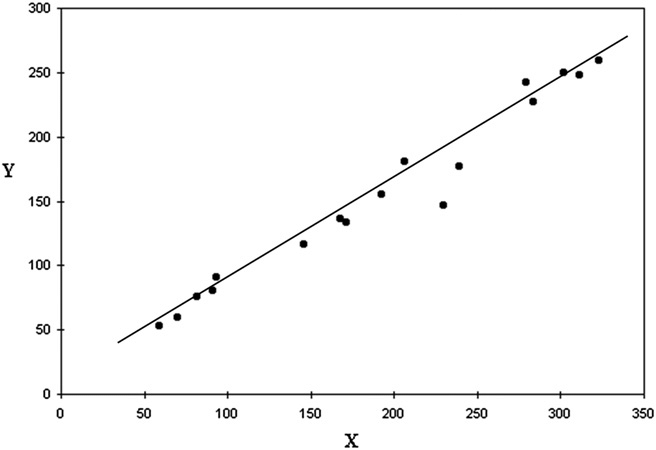
Our regression line is simply an estimate based on the data we have available. Therefore, the higher the error term, the less certain our regression line is.
It’s important to note that correlation is not causation: Whenever you’re working with regression analysis, or any other analysis that attempts to explain the impact of one factor on another, you need to remember an important adage: “Correlation is not causation”. This adage is essential. Here’s why: It’s easy to say that there’s a correlation between rainfall and monthly sales. Regression shows that they are indeed linked. But it’s quite another to say that rain causes sales. Unless you’re selling umbrellas, it can be difficult to prove a direct causal link.
It’s also important to let data replace intuition. That’s why we recommend always overlaying your intuition on the data. Ask yourself whether the results match your understanding of the situation. And if you find that something doesn’t make sense, ask yourself whether the data was right, or whether there is indeed a significant error term.
If you think the data doesn’t make sense, we can help. Every analysis must be accompanied by a real-life study. Even the best scientists and managers always take both into account.